Food personalization and the growing link made between food and health
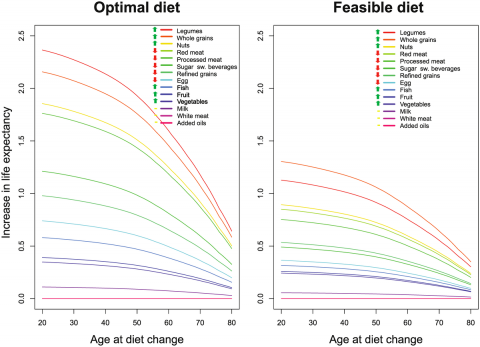
In this recent study, we can see how some modifications in our diet could have a direct impact on our life expectancy.

This paper and this graph are just a part of a large body of research that looks to connect the dots between what we eat and our health.
How does it relate to FoodTech? It is necessary to make these links between diet and health scientifically and in the mind of the consumer to be able to make recommendations. Then, personalizing food will make sense (first to help consumers understand their needs, and then to propose personalized foods).
Food-related greenhouse emissions and why companies should adapt now

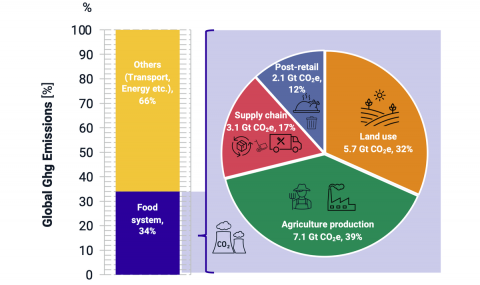
This graph comes from a recent MSCI and Blue Horizon report on how alternative proteins can be a driver to reach net-zero emissions. Beyond this interesting graph, the report finds that:
- A transition to alternative proteins could sequestrate (i.e. remove!) the equivalent of the past 9 to 16 years of CO2
- Large food companies could avoid a $295B loss of market capitalisation if they shifted to plant-based proteins (a good incentive for CEOs to invest in the category)
Alternative proteins investments rising everywhere

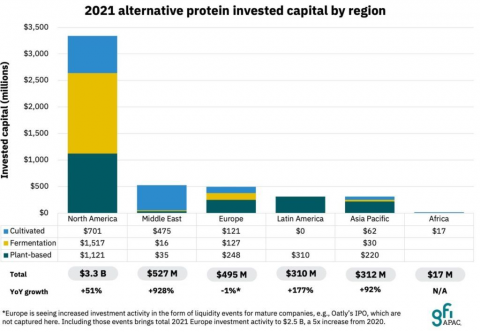
The APAC Good Food Institute released its report on investments in alternative protein startups in 2021. The growth of these investments is impressive, especially in “new regions” (APAC, Middle East (i.e. Israel) and Latin America) and in cellular agriculture.
It gets faster to build a unicorn

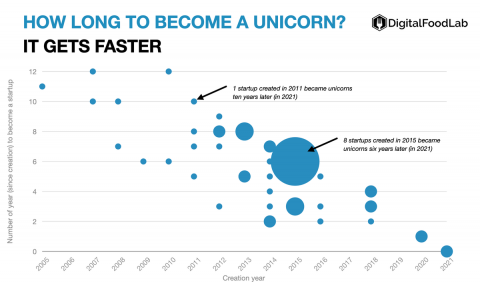
In DigitalFoodLab’s recent report on unicorns, we have mapped the long it took for startups to reach the one billion valuation. If the average time remains constant (around six years), it is because of the massive amount of startups that became unicorns last year (most being founded six years ago). We can see that for more recent companies it gets faster and faster (a couple of startups became unicorns in the year they were founded).
Have you seen other graphs (and memes) that you find interesting about the future of food? Share them with us for our next “charts newsletter”.


