I have selected some of the best graphs and charts that I have seen in recent articles and newsletters.
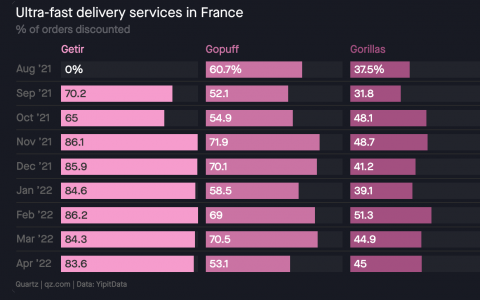
30 to 80% of quick-commerce orders are discounted

This article provides a wealth of data on how much quick-commerce (less than 10 to 30 minutes grocery deliveries) are discounted in various countries.
It seems that the more intense the competition is, the more the players are discounting the orders made by consumers. Discount is normal in a context of rapid growth and intense competition to acquire the most consumers. Would consumers remain if the discounts were removed?
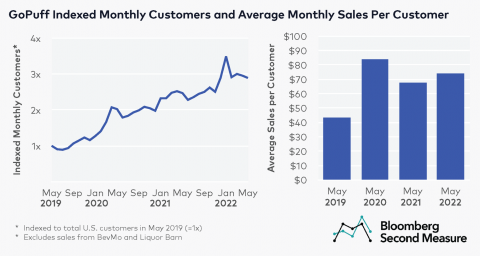
GoPuff is gaining new consumers and increasing its sales per consumer

Beyond the (many) doubts around quick-commerce players, it is interesting to look at the evolution of one of the more mature startups in this space, GoPuff. It shows how it has been able to grow fast while increasing the amount it sales to each consumer monthly. Creating loyalty, repeat orders and increasing the size of each of them are three key elements for quick-commerce is ever to be profitable.
The average size order, the holy grail of quick-commerce

These graphs (made earlier this year, previously to the current inflation context on wages and food) are a simple (yet effective) demonstration of the importance of the average order size to be profitable as a quick-commerce startup. We could add things such as the number of orders per day or economies of scale, but it gets to the main point: companies have to sell more (and more often) to each consumer.


